AlphaValue Corporate Services
This research has been commissioned and paid for by the company and is deemed to constitute an acceptable minor non-monetary benefit as defined in MiFID II

Dolfines

CR
Bloomberg   ALDOL FP
Engineering-Heavy Constr.  /  France  Web Site   |   Investors Relation
Capital increase to bring some order
Target
Upside 892%
Price (€) 0.01
Market Cap (€M) 1.62
Benchmarks Current multiplesWeightValues (€)Upside 
DCF (Edit and simulate)  35%0.091,559%
NAV/SOTP per share   20%0.101,680%
EV/Ebitda Peers 5.1 x 20%0.01100%
P/E Peers -11.4 x 10%0.00-50%
Dividend Yield Peers 0.0% 10%0.00-100%
P/Book Peers 0.3 x 5%0.01100%
Target Price  100%0.06892% 
Valuation matters
Oil & Gas

We expect 2020 to be the nadir in activity, yet maintain a cautious stance as oil majors continue to exert a strong capital discipline.
We expect the Solutions and Contracting divisions to win c. €400-600k of awards from 2022 to 2024. Dolfines has expertise that can be applied early in the cycle, such as technical refurbishment, yet offshore drilling remains subdued.
The DCF is based on a 4% EBITDA growth for the oil and gas activities.

New Energies

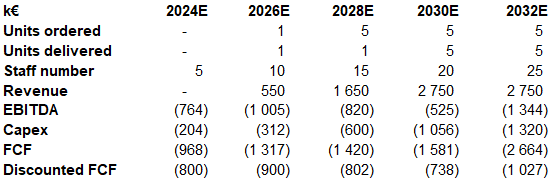
We have decided to isolate the New Energies division and show the sum of its discounted cash flows in 2023. This gives more clarity on the contributions of both the Oil and Gas and New Energies divisions and allows for a more suitable modelling of start-up projects. We expect Dolfines to receive c.50 orders for 15MW floaters, c. 5% of the total market. From 2033 onwards, we have applied a long-term EBITDA and capex growth rate of 9%. Note that, worldwide, floating wind installations are expected to grow by close to 20% CAGR from 2030 to 2040.

Key DCF metrics for selected years

Sum of the parts

Our sum of the parts valuation is based on multiples from comparable companies in each business line. 8.2 France is valued at the transaction price (c. €800k).

We value the Audit & Inspection division (Fatorig) at 8.5× 2023-24 EBIT, vs 15-17x for pure plays in inspection, testing and certification (Bureau Veritas, SGS, Eurofins Scientific), and justified by the cyclicality of the oil and gas sector.

The Services division is value at a multiple of 0.2x to 2023 sales, a 40% discount over its peers specialised in human resources and support services (Randstad, Adecco) and justified by the volatility in activity.

For the Contracting and Services divisions, we have applied a multiple of 5x to 2023 EBIT, using a discount to engineering companies operating in the energy field (Elecnor, Technip Energies) in order to reflect the risks inherent to a smaller company.

For the NAV of the New Energies division, we value the floating offshore wind division using a DCF method as applying a multiple on EBIT or EBITDA would require to select arbitrarily a reference year and therefore be dependent on a still uncertain timing. As a reminder, we use a 8% cost of debt and a 10% WACC.

Comparison Based Valuation
Computed on 18 month forecastsMcap (€M]P/E (x)Ev/Ebitda (x)P/Book (x)Yield(%)
Peers ratios 61.5 8.70 1.89 1.07
Dolfines's ratios -11.4 5.11 0.31 0.00
Premium 30.0% 30.0% 30.0% 0.00%
Default comparison based valuation (€) 0.00 0.01 0.01 0.00
Nordex SE 2,719 -46.015.32.580.00
Elecnor 1,053 8.734.321.113.89
DCF Valuation Per Share Help View DCF history
WACC % 9.14
PV of cashflow FY1-FY11 €th 24,129
FY11CF €th 659
Normalised long-term growth"g" % 2.00
Sustainability "g" % 2.00
Terminal value €th 9,222
PV terminal value €th 3,845
PV terminal value in % of total... % 13.7
Total PV €th 27,974
Avg net debt (cash) at book v... €th 930
Provisions €th 3.34
Unrecognised actuarial losses... €th 0.00
Financial assets at market price €th 0.00
Minorities interests (fair value) €th 0.00
Equity value €th 27,041
Number of shares Th 285,871
Implied equity value per share 0.09
Sustainability impact on DCF % 0.00
Assessing The Cost Of Capital Help
Synthetic default risk free rate % 3.50
Target equity risk premium % 5.00
Tax advantage of debt financ... % 25.0
Average debt maturity Year 5
Sector asset beta x 1.12
Debt beta x 1.60
Market capitalisation €th 1,618
Net debt (cash) at book value €th 963
Net debt (cash) at market value €th 10.1
Company debt spread bp 800
Marginal Company cost of debt % 11.5
Company beta (leveraged) x 1.13
Company gearing at market v... % 59.5
Company market gearing % 37.3
Required return on geared eq... % 9.14
Cost of debt % 8.63
Cost of ungeared equity % 9.12
WACC % 9.14
DCF Calculation Help
  12/21A 12/22E 12/23E 12/24E Growth 12/25E
Sales €th   4,392 7,600 9,279 10,754 6.00% 11,399   
EBITDA €th   -1,423 -219 -197 1,149 6.00% 1,217   
EBITDA Margin %   -32.4 -2.89 -2.13 10.7 10.7   
Change in WCR €th   0.00 -200 0.00 0.00 4.00% 0.00   
Total operating cash flows (pre tax) €th   -1,423 -419 -197 1,149 1,217   
Corporate tax €th   -0.15 0.00 0.00 -232 4.00% -241   
Net tax shield €th   -34.1 -34.1 -34.1 -34.1 4.00% -35.5   
Capital expenditure €th   -600 -600 -600 -600 4.00% -624   
Capex/Sales %   -13.7 -7.89 -6.47 -5.58 -5.47   
Pre financing costs FCF (for DCF purposes) €th   -2,057 -1,054 -832 283 317   
Various add backs (incl. R&D, etc.) for DCF... €th   24,648   
Free cash flow adjusted €th   -2,057 -1,054 23,816 283 317   
Discounted free cash flows €th   -2,057 -1,054 21,821 237 244   
Invested capital   4.88 5.36 5.62 5.84 6.07   
NAV/SOTP Calculation
 % ownedValuation technique Multiple used Valuation at 100%
(€th)
Stake
valuation
(€th)
In currency per share
(€)
% of gross assets
Dietswell New Energies 100% DCF 25,160 25,160 0.09 83.5%
Dietswell Factorig 100% EV/EBIT 8.5 2,800 2,800 0.01 9.30%
8.2 France 100% AlphaValue valuation 800 800 0.00 2.66%
Dietswell Solutions 100% EV/EBIT 5 500 500 0.00 1.66%
MaintControl 100% AlphaValue valuation 500 500 0.00 1.66%
Dietswell Services 100% EV/Sales 0.2 360 360 0.00 1.20%
Dietswell Contracting 100% EV/EBIT 5 0.00 0.00 0.00 0.00%
Other
Total gross assets 30,120 0.11 100%
Net cash/(debt) by year end -963 0.00 -3.20%
Commitments to pay -150 0.00 -0.50%
Commitments received
NAV/SOTP 29,007 0.10 96.3%
Number of shares net of treasury shares - year end (Th) 285,871
NAV/SOTP per share (€) 0.10
Current discount to NAV/SOTP (%) 94.4 View history

Changes to Story : 01/02/2023, Changes to Forecasts : 01/02/2023.